
In this post I am going to be comparing seven categorical features that I recoded from the dataset, to try and get the highest precision, recall, f1, accuracy, and prediction scores. I will make a confusion matrix to show the most accurate prediction for each level, so for the highest values with one feature then two and so on. I got this dataset from kaggle originally and recoded the numeric columns to their equivalent categorical. Going into this I am expecting that the course_cat and gender columns will impact the scores the highest since the course column has a wide range of classes and the gender should give a good split on the data.
https://www.kaggle.com/datasets/thedevastator/higher-education-predictors-of-student-retention
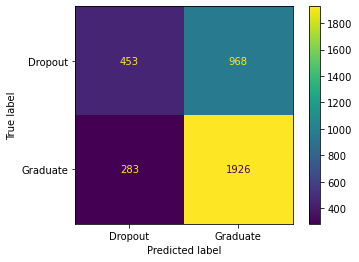
My highest one value alone was the course_cat column which was the columns that had the courses the student was enrolled in, here are the values and confusion matrix for that column. Considering looking that the predictor got 64% F1 for just one feature that is a very good feature since there is over 35 features in the whole dataset that means the course the student was in has a very high rate by itself.
Accuracy: 0.6859504132231405
F1-score: 0.6443150513398449
Average precision: 0.6533690114823829
Average recall: 0.6553719008264463
Average F1 0.6227310408979837
Looking at my confusion matrix I got 453 True Positive values, 968 False Positive, 283 False Negatives, 1926 True Negative
Next I compared every other feature to the course feature and found that course and scholarship together were the highest among them all, here are the values and confusion matrix of that one. The scholarship column and course column together added to be the second highest value of an F1 of 73%, while the other columns actually brought the predictor down, which is probably because the gender for example didn’t have the best matchup with the course column.
Accuracy: 0.7355371900826446
F1-score: 0.7368317632780442
Average precision: 0.6986419399259287
Average recall: 0.6977961432506886
Average F1 0.6972558024858767
Here there is 854 True Positives, 567 False Positives, 530 False Negatives, and 1679 True Negatives

For the three features Nationality ended up being the third feature that added the highest prediction value, here are the values and the confusion matrix for that set. Now the Nationality column can come into play with the course column and the scholarship column, which as I said above most likely means that the Nationality column and scholarship column went hand and hand because the F1 stayed relatively the same here at 73.3 while it went down for every other column mixed with course and scholarship.
Accuracy: 0.7327823691460055
F1-score: 0.7333657712947298
Average precision: 0.6965661008102548
Average recall: 0.6975206611570248
Average F1 0.696732808466049
Here there is 839 True Positives, 582 False Positives, 527 False Negatives, and 1682 True Negatives

My next highest prediction value was for course, scholarship, nationality, and gender here are the values and the confusion matrix for that. Adding gender made the accuracy go down a little bit to 70.2 , which I have my theory as to why is because the gender and nationality are not using each other as good as I thought they would, this is normal though it is common for the confusion matrix and f1 to go down slightly not every column will always make a positive difference.
Accuracy: 0.7079889807162535
F1-score: 0.7027808573540282
Average precision: 0.6985773751464521
Average recall: 0.7030303030303031
Average F1 0.6983946991748324
Here there is 785 True Positives, 636 False Positives, 442 False Negatives, and 1767 True Negatives

The next highest value was the displaced feature so we are now up to five features here’s the updated values and confusion matrix. The next highest addition was adding the displaced column which actually brought it even lower since the last one which is normal but we are now at 67% F1 so still right now the best combinations are with just two features which is a little shocking but thinking about what we are trying to find courses and scholarships make sense to be some of the highest values.
Accuracy: 0.6721763085399449
F1-score: 0.6713546502310838
Average precision: 0.7056193983805967
Average recall: 0.7074380165289256
Average F1 0.7049748102390314
Here there are 834 True Positives, 587 False Positives, 475 False Negatives, and 1734 True Negatives

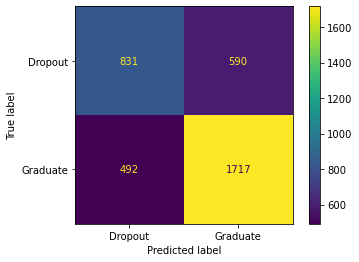
The 6th feature being added is now the marital status of the student and with these 6 columns here are my values and the confusion matrix. Now this is starting to increase again from where we just were back up to 70% f1 with the addition of the marital status. Which I thought would’ve been added before now possibly the 3rd or 4th best feature but having it at 6th gives the highest accuracy.
Accuracy: 0.7079889807162535
F1-score: 0.7004894774432254
Average precision: 0.7011525271148762
Average recall: 0.7019283746556473
Average F1 0.6999156289535691
Here there are 831 True Positives, 590 False Positives, 492 False Negatives, and 1717 True Negatives
Now since we have compared all of them the 7th must be attendance so let’s see the final prediction values I got. Now with all seven values that are the highest amongst each other I see that we are at 72.8% F1, which is not the highest but it still has made its way back up to where it was.
Accuracy: 0.7272727272727273
F1-score: 0.7288041880764838
Average precision: 0.6928300955320715
Average recall: 0.6950413223140497
Average F1 0.6926414223613386
Here there are 811 True Positives, 610 False Positives, 497 False Negatives, and 1712 True Negatives

Overall, my highest percentage predictor was with course and scholarships at 73.6% F1 which looking back at my previous analysis on this dataset with only 2 columns being used but calculating it using naive bases algorithm and more of a probability approach I got right around the same percentage accuracy in both. I would like to continue analysis on this dataset and hope to fix some of the unstable columns with a lot more broad information and see how high I can really get this F1 and Accuracy I would feel very good getting it to 90% which I believe is very possible for this data.