Hotel Reservations do they actually show or cancel?
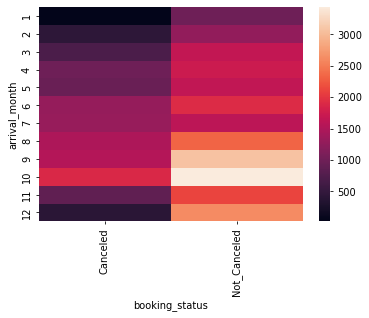
I chose this dataset because I found comparing if someone cancels their hotel reservation to the month, meal plan, etc very interesting. Overall this analysis I found a few things that I believe correlate some columns to if someone will cancel or stay with their reservation. The dataset I found was on Kaggle (https://www.kaggle.com/datasets/ahsan81/hotel-reservations-classification-dataset). I observed a lot in this dataset and found a lot of things interesting such as The fact that the fall months had the most reservations personally was expecting a summer month to be the highest, but I do understand traveling to more scenery-based places like the mountains is very common. I also found the difference in cancel verse non-cancel was about 75% compared to 25%. I did notice on the heatmap that although October had the highest reservations its balance of cancel to not canceling was close at around 3,500 showing and 2.500 not. Although in another month say December there were around 2.500 non-cancels and only around 400 cancels, assuming because a lot of people are visiting family and have some big priorities when it comes to travel.
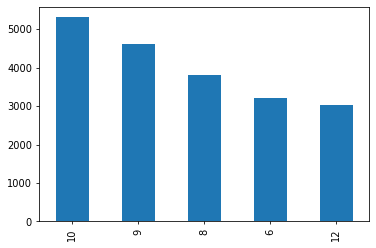
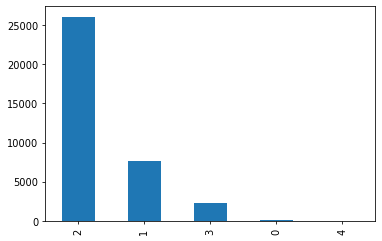
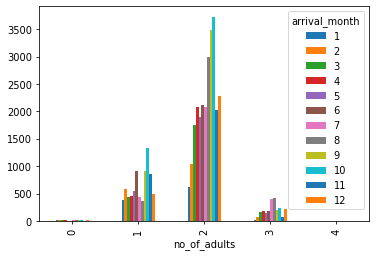
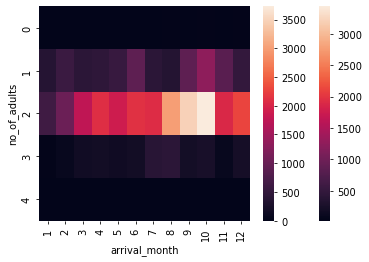
This shows the number of reservations during certain months, so as you can see for example October has the most at a little over 5000 reservations made not separating canceled versus non-canceled just the total number.So this bar plot shows the total canceled versus non-canceled reservations so again, for example, we see that in total there are around 24,000 reservations that were not canceled throughout one year and 12,500 reservations that were canceled in a year’s time.This graph was another graph I made out of curiosity to see how many reservations there are based on the number of adults. So as I actually was expecting the most common number of adults on a reservation is going to be 2 at over 25,000 and the next being 3 at around 7,500 reservations.Now combining two graphs, is a lot to look at but looking at what I said above let’s just break it down. so let’s look at the highest of each that I said so 2 adults and October is going to be around 3,600 at the highest point of the graph followed by a close second of 2 adults in September around 3,400.This heatmap is a cross-tabulation between the arrival month and the booking status. So again let’s look at the highest and lowest the largest month is October as stated above with over 3,500 not canceled and around 2,000 canceled. and the lowest in January with less than 500 canceled and around 900-1,100 not canceled. These could be for a number of things. Here is some of my thinking a lot of people are just finished traveling for Christmas and have also most likely spent a good amount of money around Christmas so a lot of people are not going to be traveling in the early year months. And the fall time is a very common time again as we saw two adults going on little couples getaways and weekend dates.So Now this heatmap is comparing the number of adults and the arrival month. So as expected the only super bright colors are around the 2 adults’ section again like I said in the later months like August, September, and October. With all reservations from 2,300 to 3,500. I would like to compare this with the booking status so we could see the heatmap of the number of adults per month and whether they canceled or not.
In conclusion, I can conclude that the highest month for hotel reservations will be October in both cancelation and non-cancelation, as for any month whatever months have the higher total reservations will most likely have a higher canceling rate but also a non-canceling rate.